telling a story with data
data analytics
Big data can be a big problem unless you have the right statistical tools to take complicated systems and distill them down to the few key variables that matter.
analytical toolbox
Python
Create custom scripts to deliver on demand reporting with programs that download data automatically, conduct routine analysis, and generate reports for consumption.
R
R has a broad ecosystem of statistical tools to interrogate data to the highest levels and yield beautiful charts that can be refreshed dynamically with Rmarkdown for quick publication.
Power BI
Take advantage of the Microsoft ecosystem and create powerful and interactive visuals.
Tableau
Make data analytics less intimidating by creating an interactive experiance for clients. Deliver high polish and non-linear presentations.
Snowflake
Securely and efficiently access, store, and analyze data in the cloud. Snowflake seamlessly integrates with tools like Power BI, Tableau, and Python to enable deeper insights and visualization.
Streamlit
Low code approach to creating dashboards and webapps that takes advantage of the full universe of python enabled data analytics.
ArcGIS
Ask and answer questions using maps because spatial data requires spatial analytics. Create webmaps for locational analysis on the fly.
Excel
Sometimes the standard workhorse is best. Deep knowledge of pivot tables and queries to make quick work of complex questions.
html & css
The ability to communicate using the web is vital. Use a webpages to create non-linear and dynamic presentations that follow a conversation and not an agenda.
statistical methods
ARIMA Models
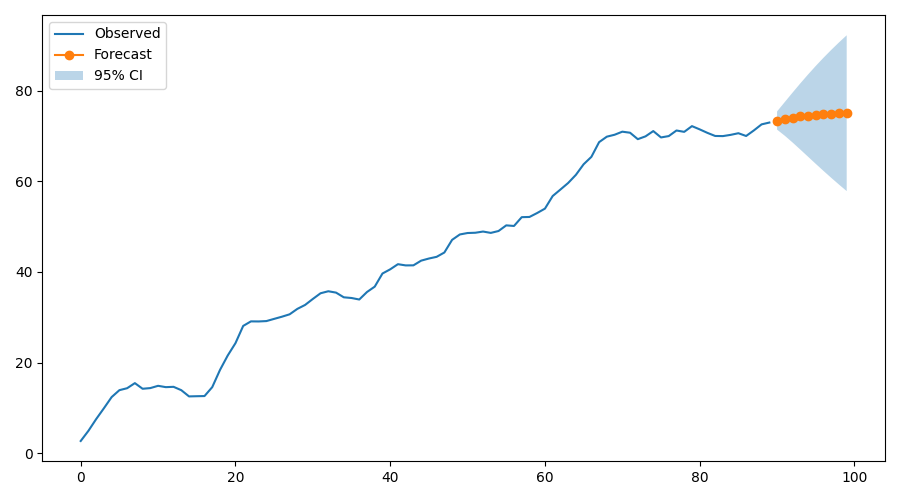
A blend autoregressive and moving average process to model complex systems.
GARCH Models
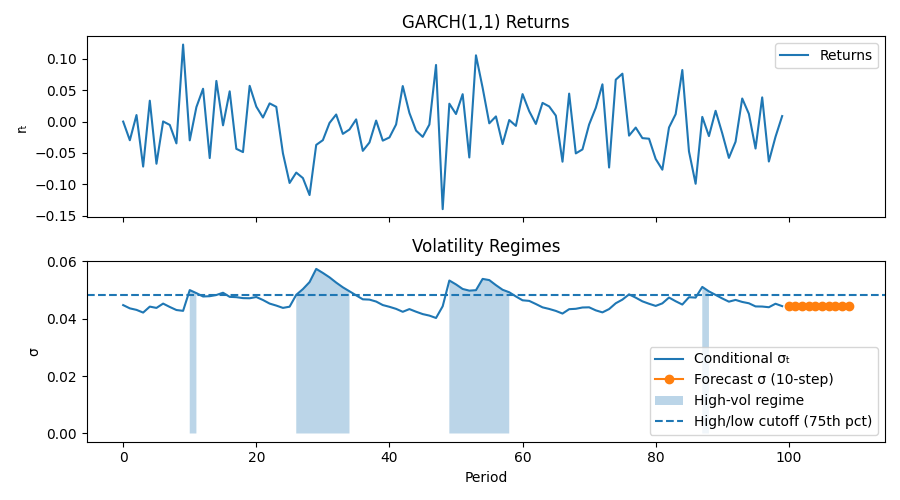
Allow model volatility to adapt across time.
Markov Chain Monte Carlo Simulation
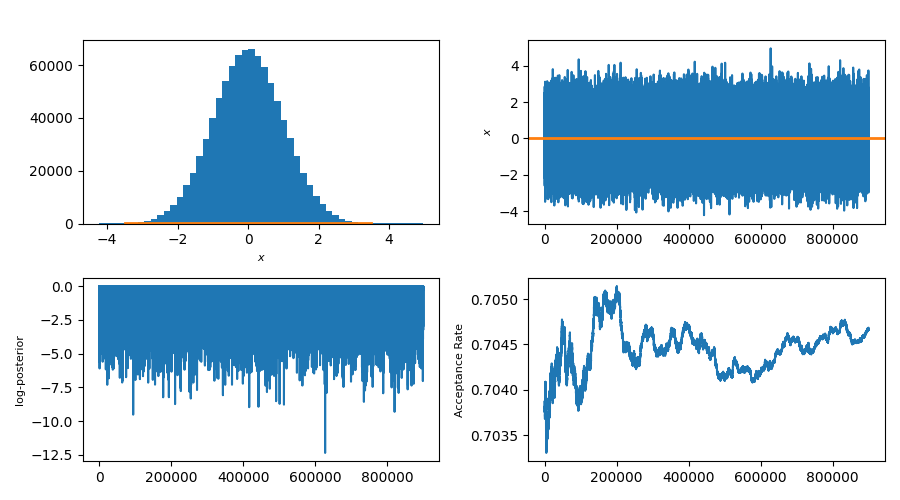
Model randomness and study complexity by simulating random walks.
Dynamic Stochastic Models
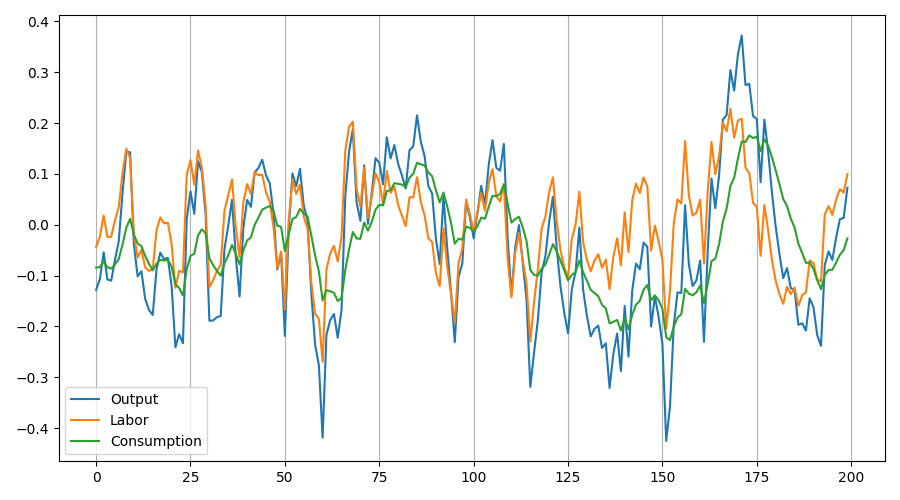
Build an economy and watch it adapt and evolve across time.
Impulse Responses
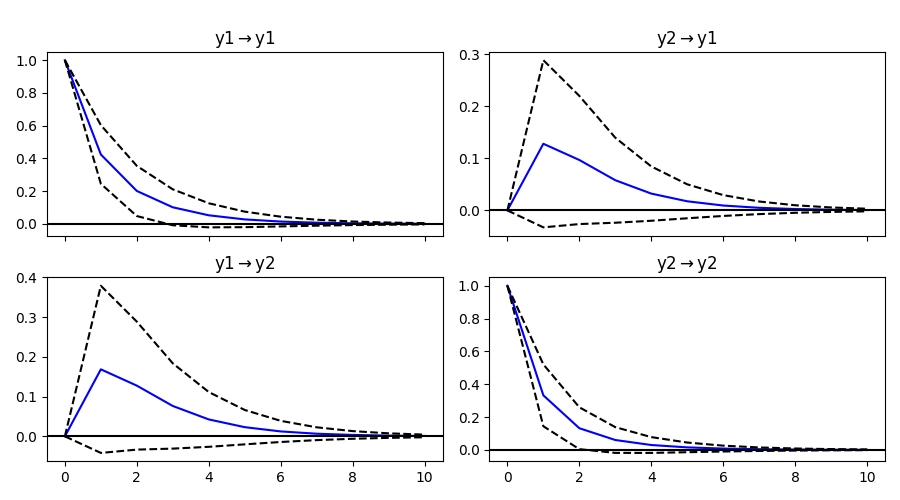
Use time-series analysis to build dynamic models and study how shocks to the system play across time.
K-means Clustering
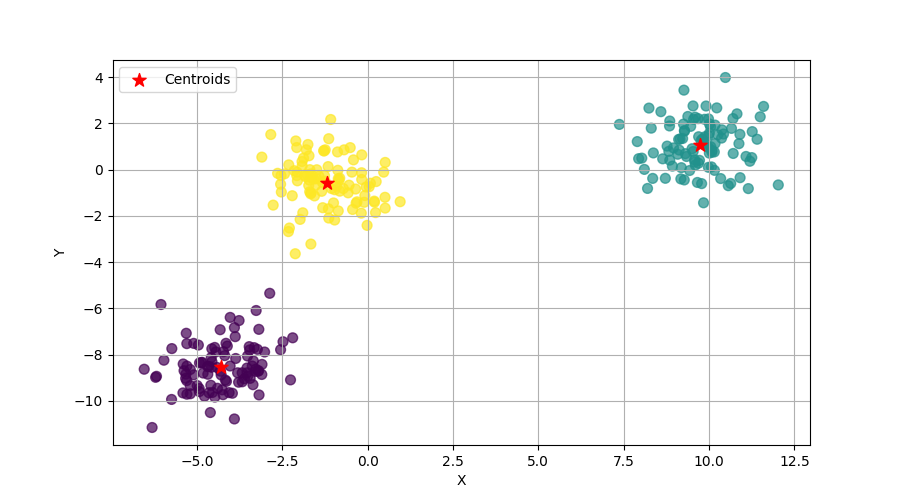
Use time-series analysis to build dynamic models and study how shocks to the system play out over time.
Hedonic Modeling
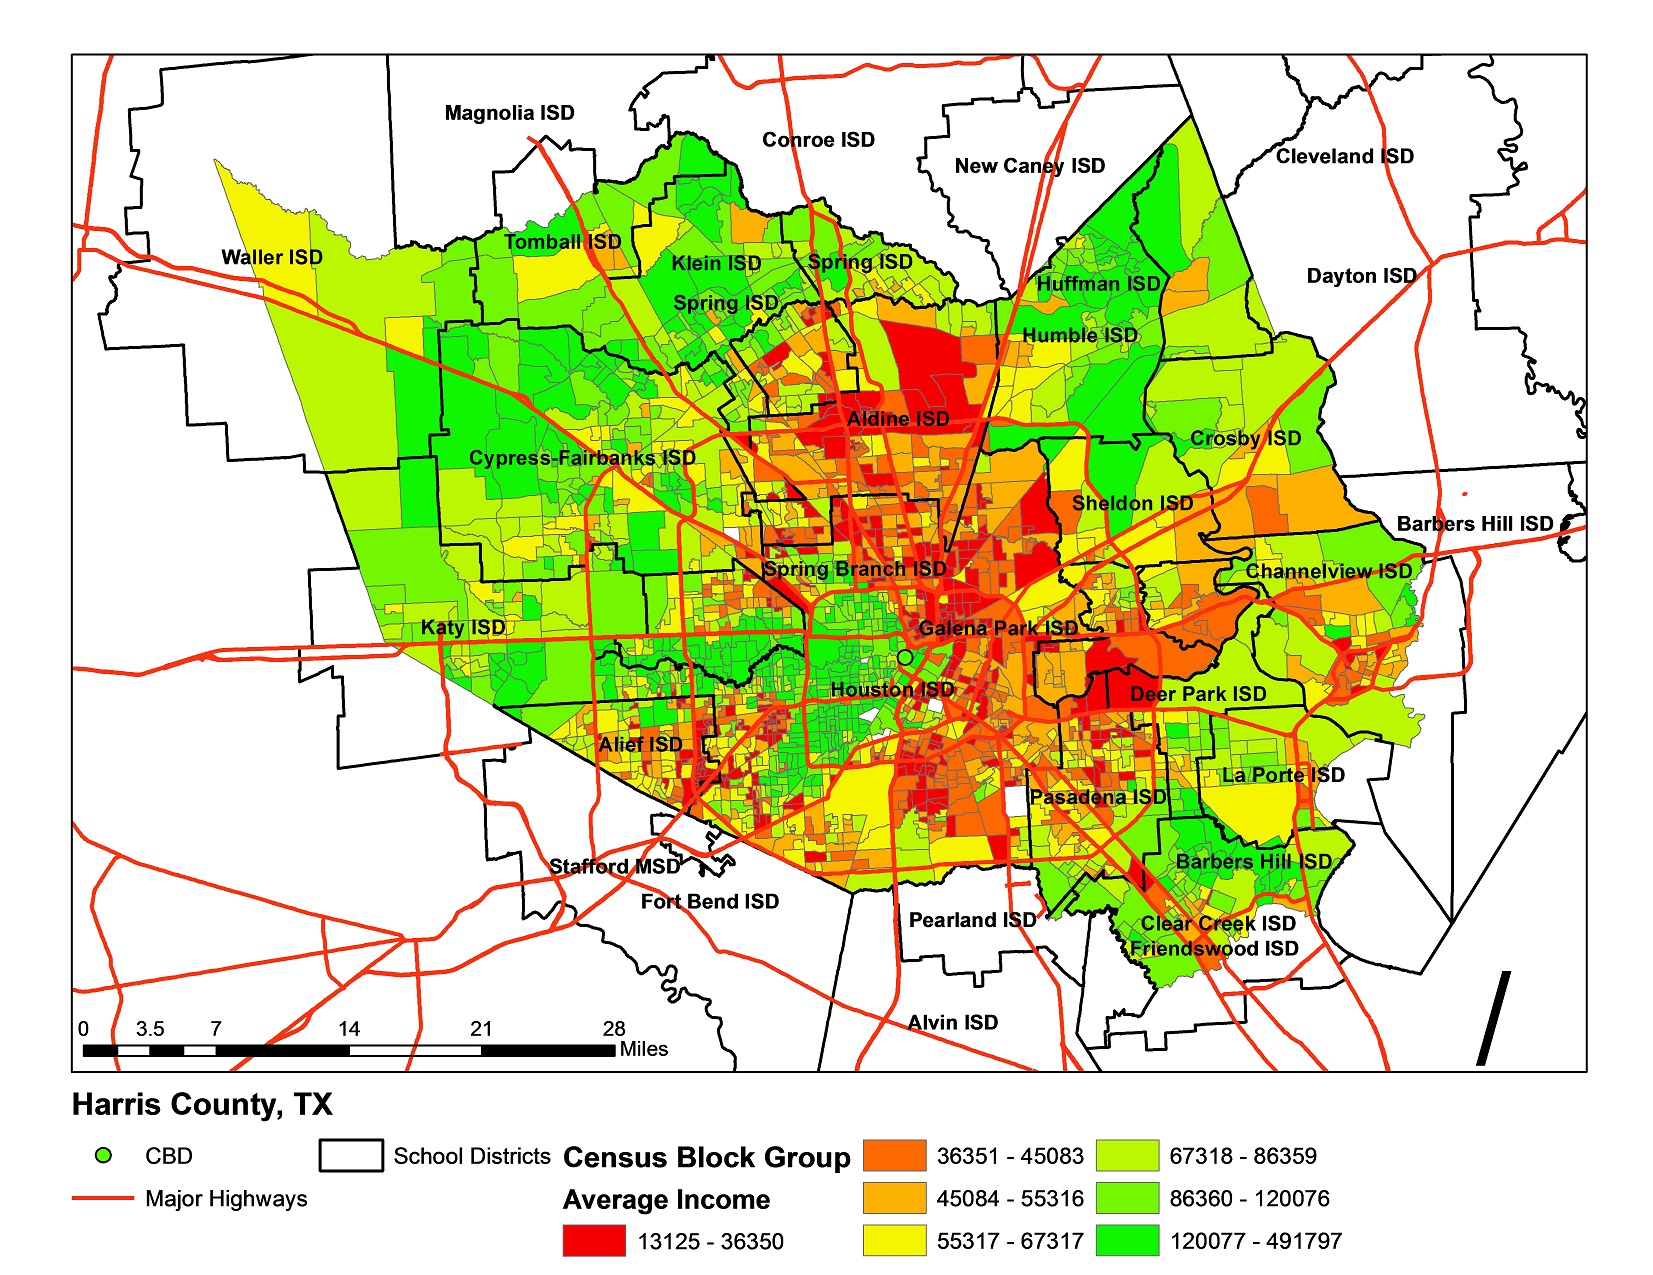
Study the impact location and amenities have on price.
Spectral Analysis
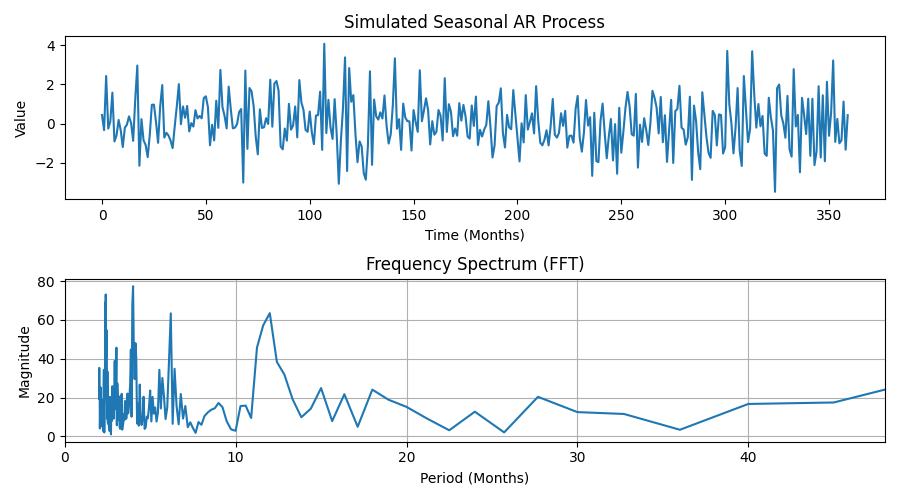
Identify and model seasonal patterns in data.